
It is easy to overlay your own points of interest over Vexcel Imagery in common GIS tools like the Esri family of applications and QGIS. This is especially useful in Catastrophe response situations where insurers want to overlay their policy information over the graysky imagery.
In this tutorial, we’ll look at how to add Vexcel layers into QGIS, import your points of interest as an overlay, and do some simple analysis.
Before you get started, you should have an account providing data access to the Vexcel platform. If your organization has a license to our imagery and you need an account, email your request to support@geointel.org
Step 1: Install QGIS if you don’t already have it. It is a free download for all platforms. Install it from here.
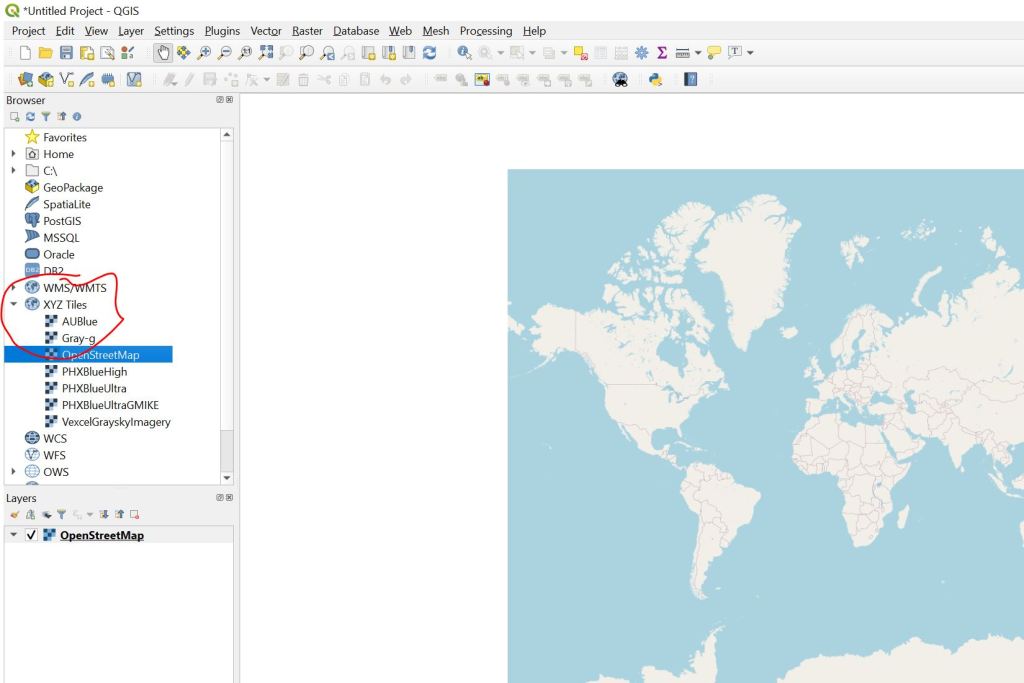
Step 2: Start QGIS and add the OpenStreetMap Basemap Layer. I start every project by adding this layer, providing a high quality backdrop for Vexcel Imagery. In the left rail menu, open the ‘XYZ Tiles’ section and double-click OpenStreetMap. the layer will be added to the map canvas and show up in the layer list below.
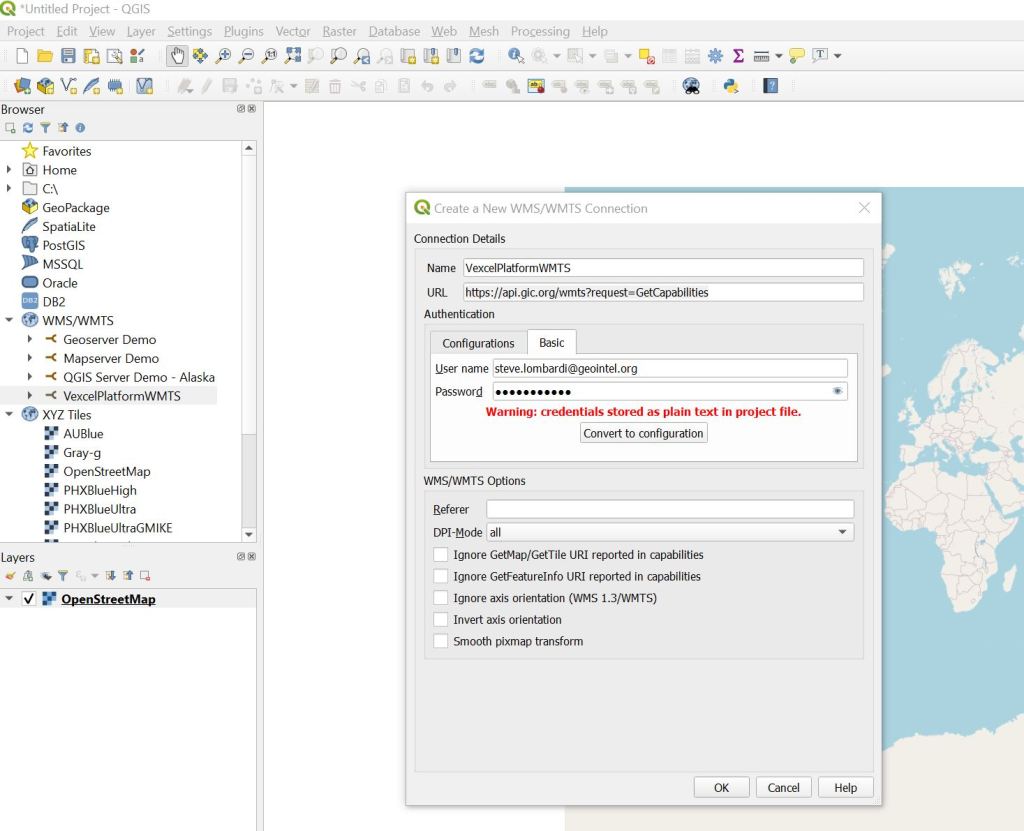
Step 3: Add the Vexcel WMTS Connection. Right Click on the WMS/WMTS section in the left menu and choose ‘New Connection…’. Give your connection a name like ‘VexcelPlatformWMTS’ and specify the URL as ‘https://api.gic.org/wmts?request=GetCapabilities’
In the Authentication section, specify your Username and Password for the Vexcel Platform. When your screen looks something like this, hit the OK button to initialize the connection.
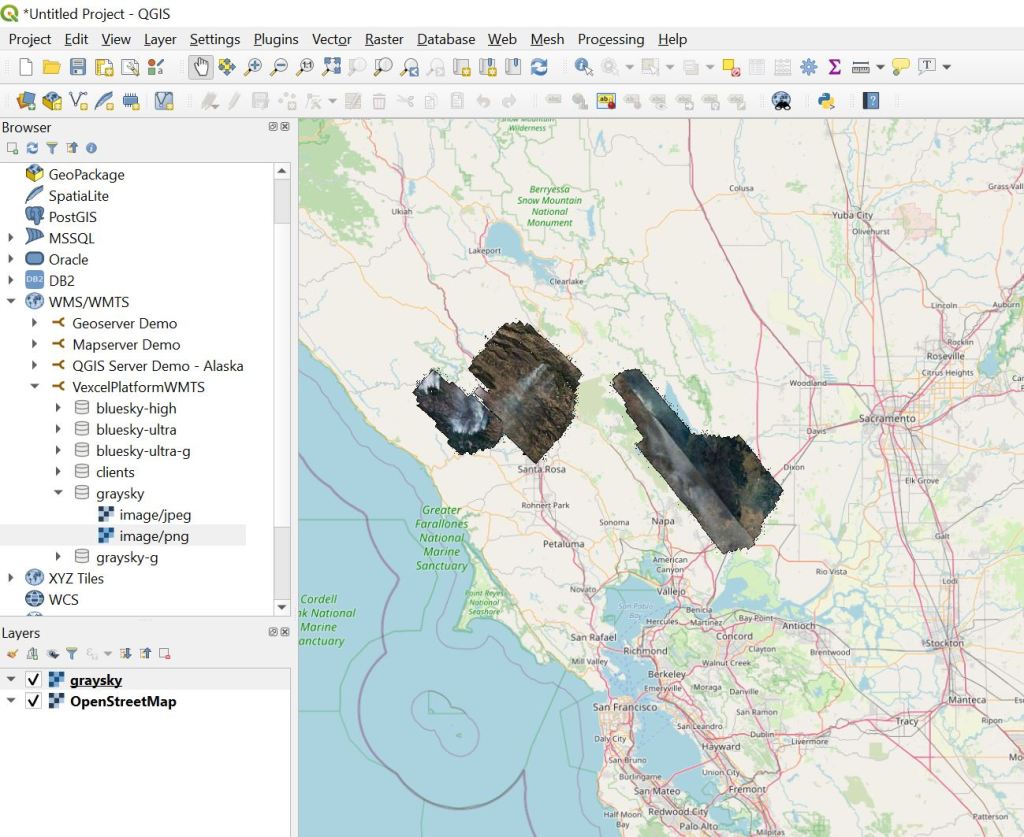
Step 4. Add a Vexcel Layer to the map. Once you’ve added the connection in step 3, all of the Vexcel Layers will appear below it. Double click any of them to expand it, then double-click on the ‘PNG’ option to add the layer to the map. We’re going to add the ‘graysky’ layer to pull in imagery from the California Wildfires. Hurricane Laura Imagery will appear in this layer as well as it becomes available.
Once the layer is added, zoom in the map north of San Francisco and you will see the imagery appear.
Step 5: Import your Points of Interest. In QGIS you can import data as overlay layers from a variety of formats. We’re going to import a simple comma separated file (CSV) exported out of Excel. Your data should have columns for Latitude and Longitude, along with any other fields of data you would like to bring along. Here is a simple CSV file that we are going to import:
latitude, longitude, name
38.4711, -122.1070, Vacaville
38.615336, -122.880297, Healdsburg
38.406523, -122.008205, Vacaville 2
In QGIS, Choose the Layer => Add Layer => Add Delimited Text Layer… Menu
Browse to select your file. QGIS will analyze it and try to find the latitude and longitude fields. Be sure the X field and Y field values match your data file. Once your screen looks something like this, hit the Add button to add your layer to the map.

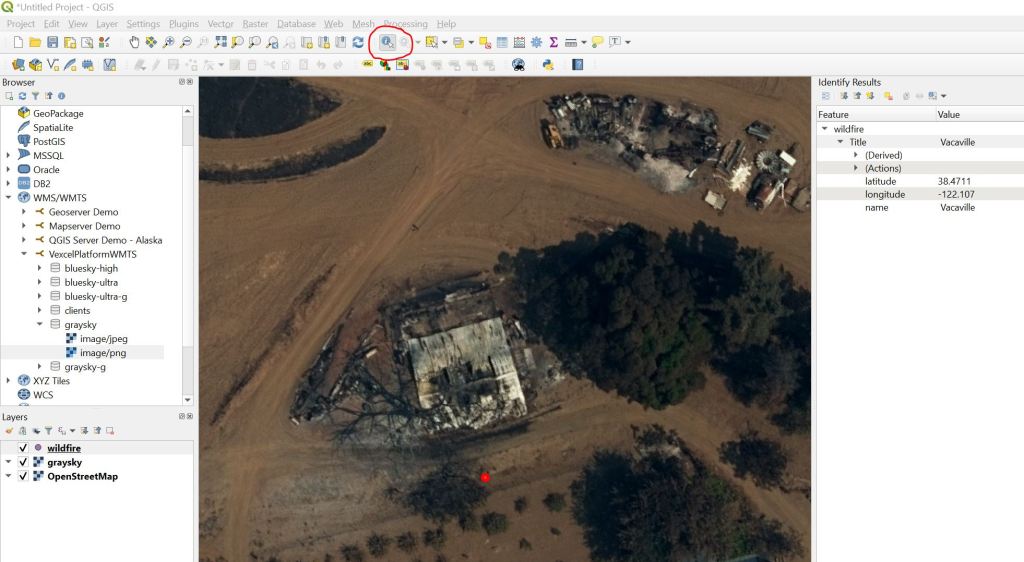
You did it! Your points should appear on the map, something like this image shows.

Here are a couple of QGIS tips. Use the ‘Identify Features’ button on the tool bar to click on one of your points to see the details as shown here.