The GIC’s collection of Hurricane Laura imagery is complete with all data now available on our platform. In total, over 22,000 square kilometers of imagery were collected over three days beginning August 27th, utilizing 11 fixed wing aircraft in the effort. We had 9 planes in the air simultaneously at one point over the collection window, our largest catastrophe response since Hurricane Michael in October 2018.
At the GIC we understand how critical it is to have imagery in the hands of first responders and our Insurance industry customers quickly, which is why we feature a 24 hour response time; from when our planes land, we target having the imagery live on our platform within 24 hours. I’m very proud to say that our team delivered the first round of imagery in 14 hours!
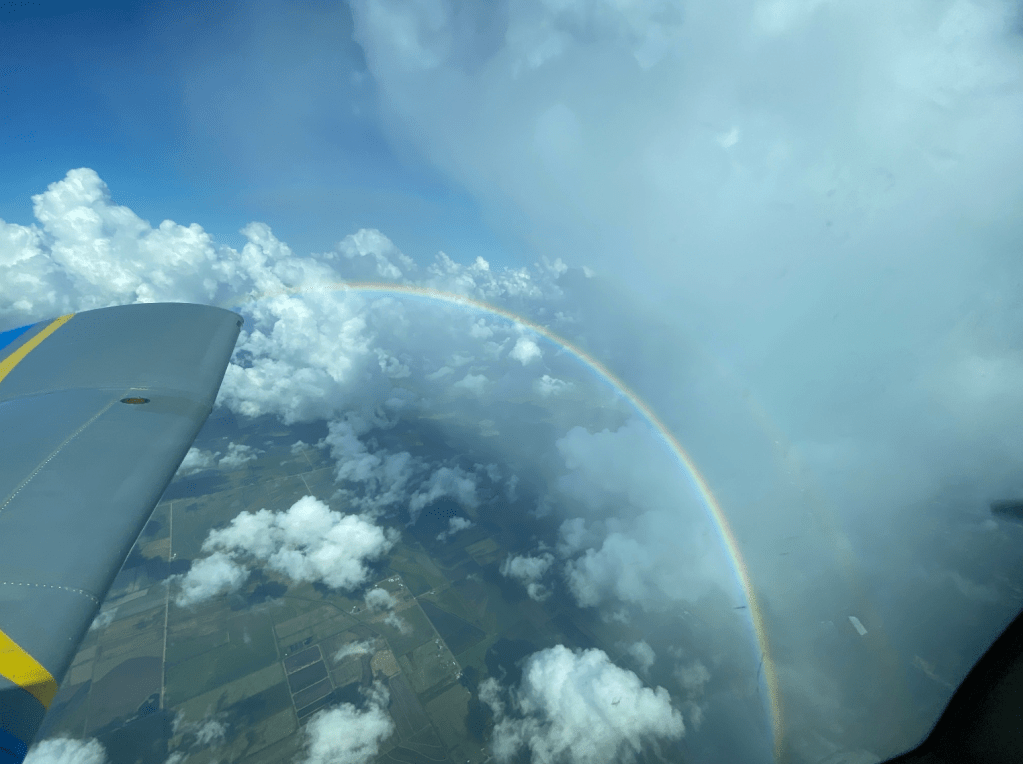
So much work goes on behind the scenes to make the end product of the images like you see in this post possible; aircraft maintenance, camera tuning, flight planning, data transport and processing, platform readiness… not to mention the continuous battle with the weather and the challenges due to covid-19. I can only imagine that its not a fun ride piloting through the levels of turbulence at low altitude that our pilots deal with for an event like this. Kudos to the women and men working from end to end to deliver the pixels!
hey, look! a rainbow
Imagery available for this event includes 3,800 sq kilometers of 7.5cm resolution imagery over the hardest hit areas including Lake Charles, as well as 20,000 square km of 20 cm coverage. Much of the 7.5 cm area includes obliques as well as nadir.
High res ortho imagery in the wake of Hurricane Laura is available for the Lake Charles region, among other areas hit hard by the storm. In this post we’ll look at the tools available in the GIC web application for Insurers to analyze their PIF or other point data sets.
The features of the viewer that we’ll focus on are:
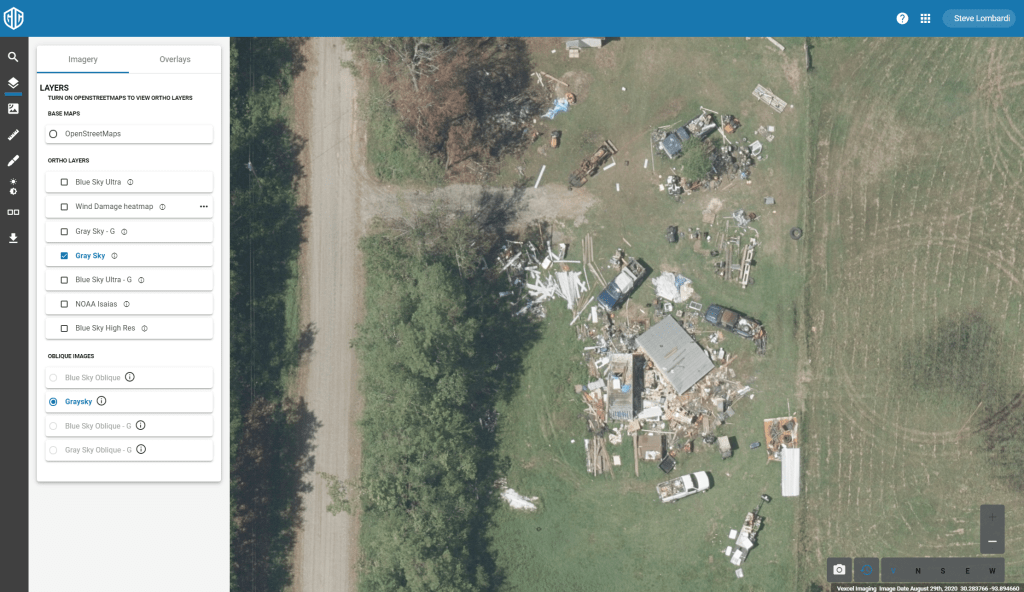
Start by going into the viewer and searching for Lake Charles, LA. Zoom out to get an overview of the area with just the gray sky layer turned on as shown here
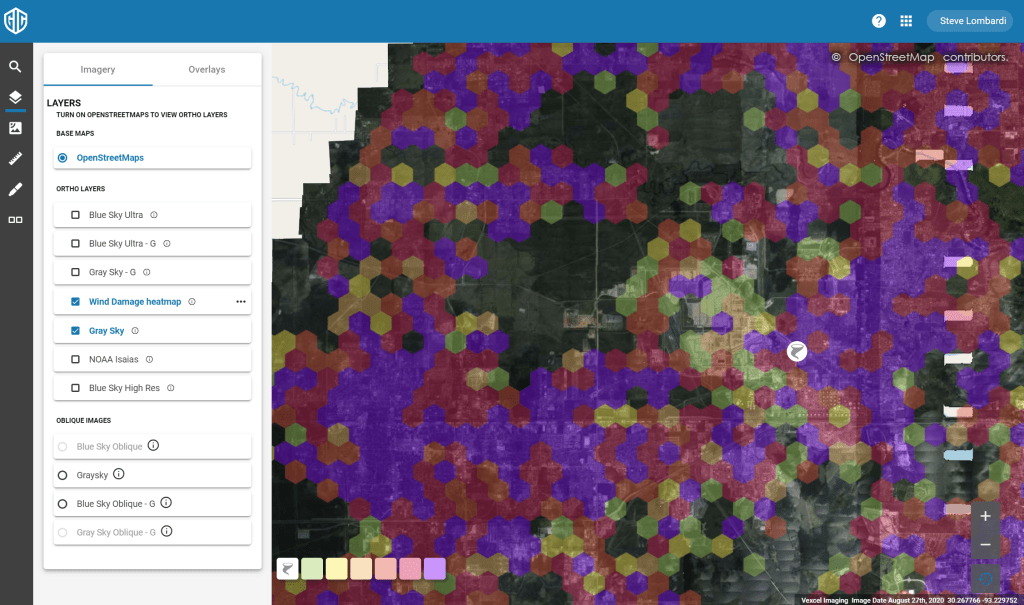
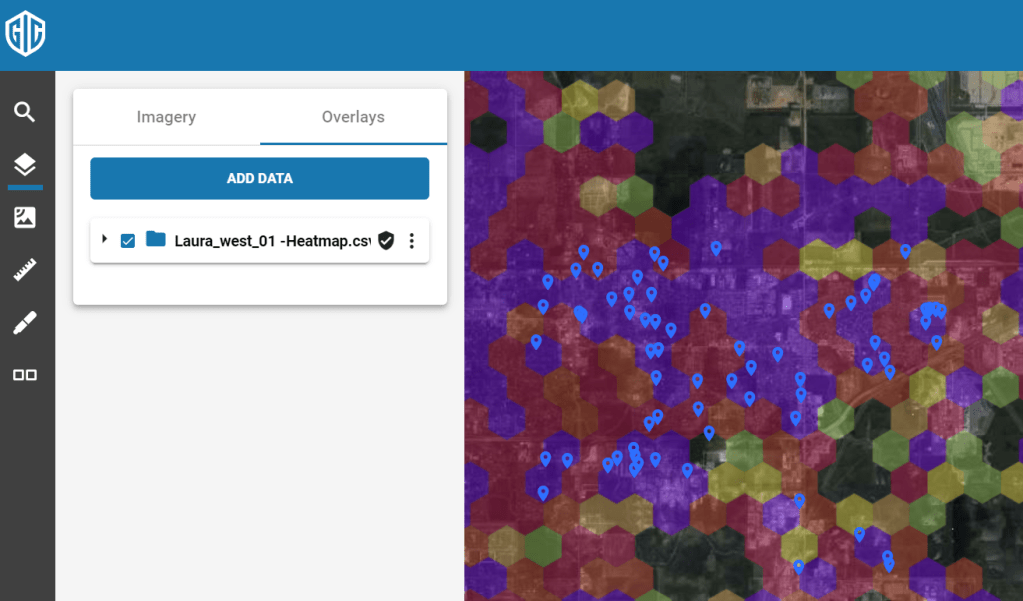
Next turn on the wind damage heatmap in the layer control. This layer is created by our partners at Munich Re using computer vision to analyze all properties in the affected region. This is a simple and very effective tool for understanding where damage in the region is greatest. As you can see here, there are almost no parts of lake Charles without at least moderate damage. The color ramp goes from light green through red and then violet indicating increasing levels of damage. Zoom in on an area and note how the hexagons ‘unfold’ to reveal more detail as you go, turning off at street level to clearly show the imagery. You can of course toggle the layer on/off at any time as well.
The Lake Charles area is approximately 900 square kilometers, far more than you could manually inspect for damage hotspots so the heatmap overlay is a very helpful tool to draw your attention to the areas of imagery with significant damage.
Next we’ll look at the data import functionality in the application. This feature is still in ‘preview’ with some added capabilities on the way, but even in the preview stage, it brings important analysis capabilities to your toolbox. You can import a variety of file formats including .KML and .SHP files, but for this tutorial we’ll use the common comma separated values (CSV) file that can be exported from Excel or any database tool. Your CSV file should contain fields for Latitude and Longitude in the first two columns, and any additional fields after that. The values in columns 3 and 4 are also important as they will be used as labels in the app.
The first line of your CSV should contain names for your fields. Latitude and Longitude should be labeled as shown, while the remainder of the labels can be whatever you like. Here is a sample that you can use:
Latitude, Longitude, AccountID, Name, notes 30.2309725, -93.3423869, P005IGPBW, Joe Smith, Your Note here 30.230995, -93.35050667, P005IGSFK, Mary Johnson, Another note here 30.233688, -93.343199, P005IGP80, Stan Lee, property note here.
Go ahead and get your CSV file setup, then come back and we’ll continue. You can save the 4 lines above in a text file on your local storage for a quick CSV file.
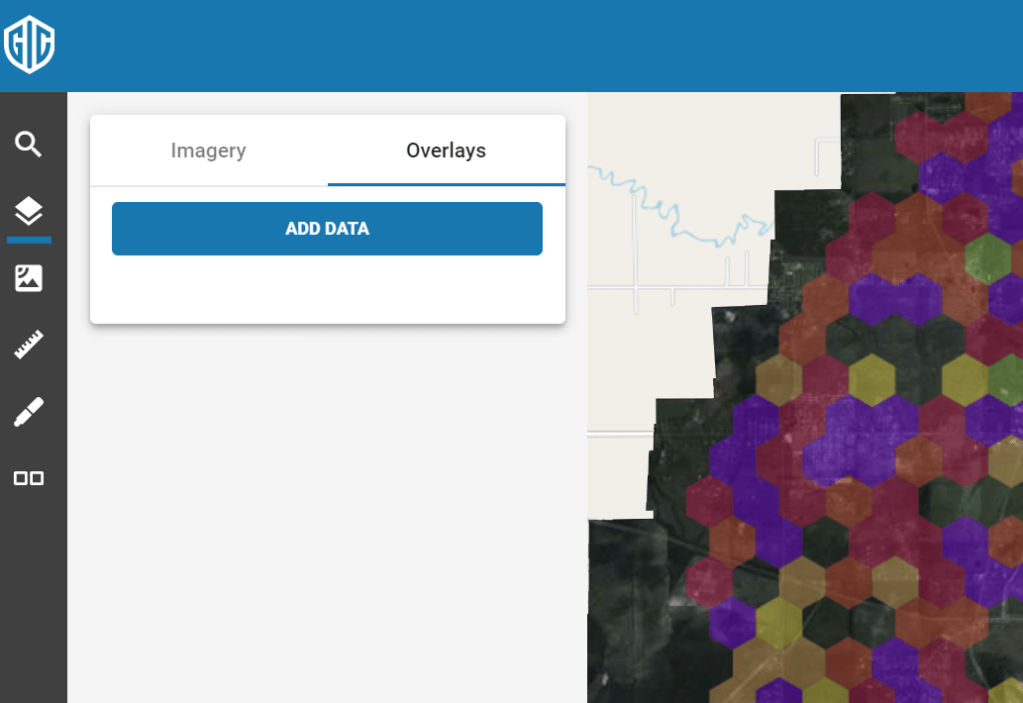
Importing is easy. Go to the Layer control in the left menu. At the top you will see two tabs; one for the imagery layers, and one for your own ‘overlays’. Choose the Overlays tab and hit the ‘Add Data’ button.
You can either browse to select your CSV file or drop it into the dialog. Either way your data is now added to the map as an overlay appearing as blue pushpins. You can toggle your layer on and off with the checkbox like any other layer.
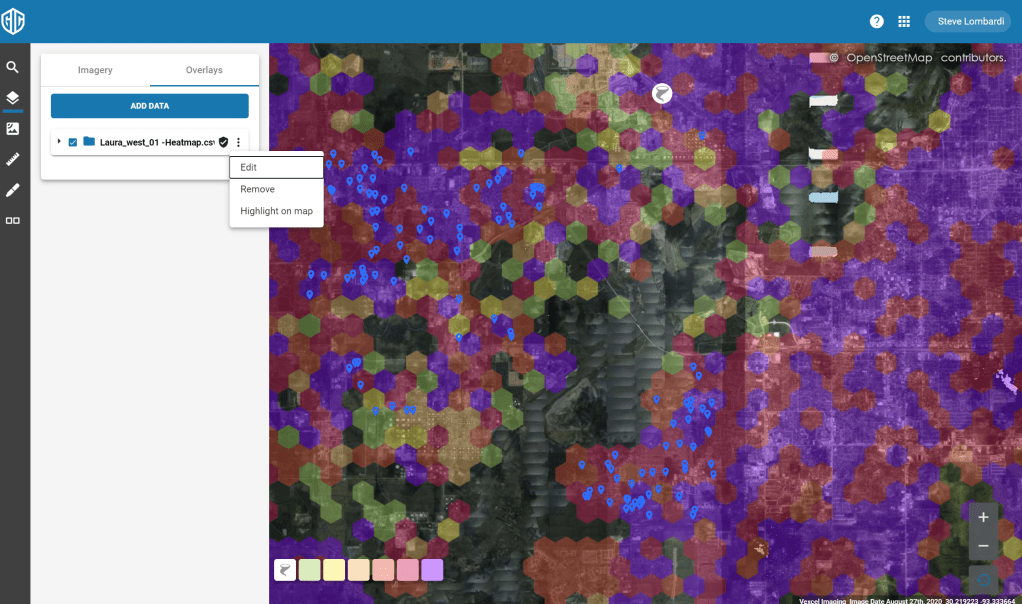
You can zoom out to see all of your points or use the ‘Highlight on map’ option on your overlay to automatically zoom out to a view that fits all of your points. You’ll find this menu choice on the … menu for your overlay as shown here:
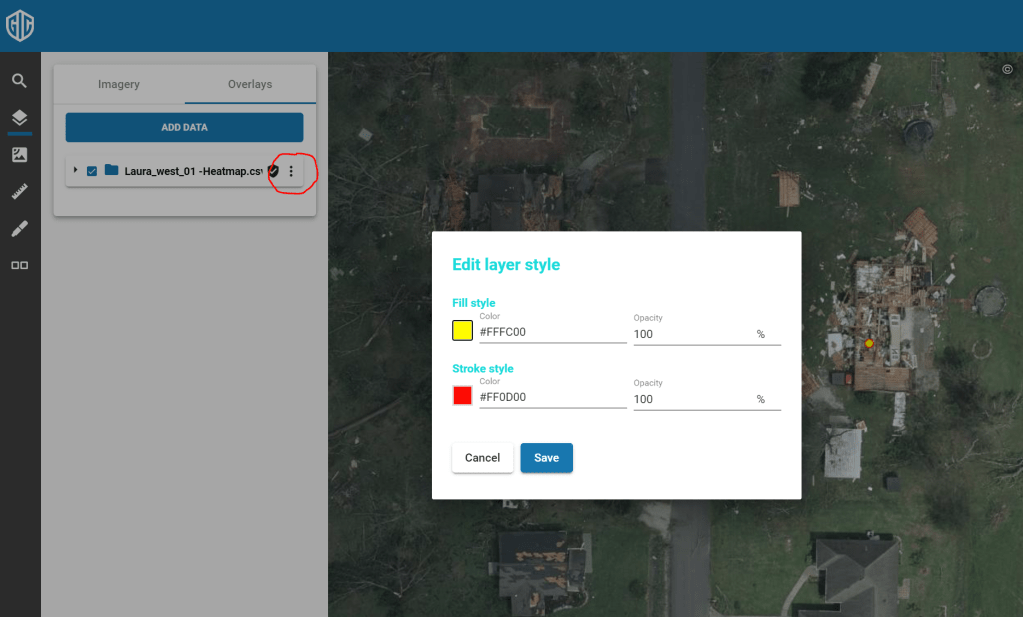
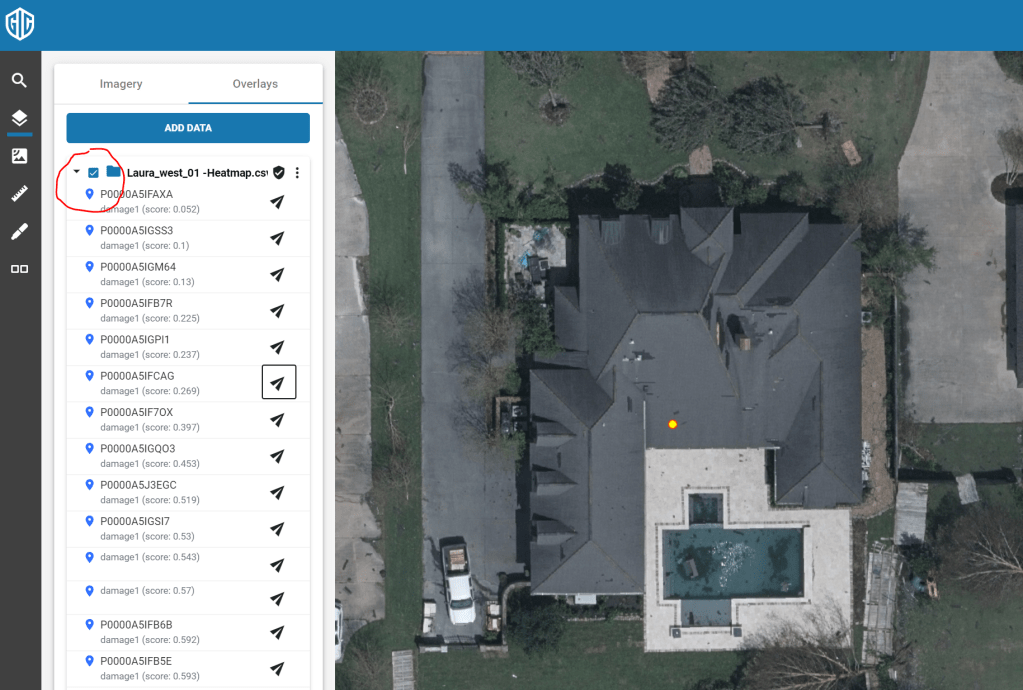
You can change the style of your pushpins with the ‘Edit’ menu choice, also found in the … menu. Here I’ve gone with a yellow pin to really pop against the imagery
And finally, you can expand your overlay to see the individual points, labeled with fields 3 and 4 from your input file. Click the icon next to any of them to center and zoom the map on that point as shown here:
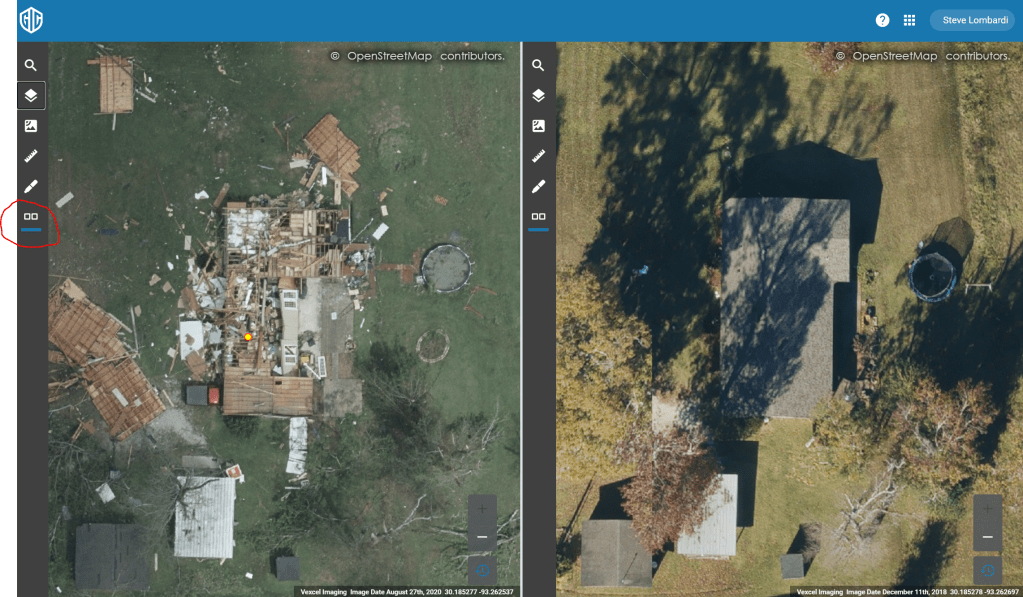
The viewer’s ‘Dual view’ feature is most often used for analysis when viewing catastrophe response imagery like our Hurricane Laura coverage. Turn it on by clicking the Dual view icon circled in the screen below. this will split the screen and provide separate layer controls for each side. In this image I have turned on the ‘Blue Sky Ultra-G’ layer with imagery from 2018. We also have 20cm imagery from 2019 in the ‘Blue sky High Res’ layer.
If you have any question on these features or any others, reach out to our tech support team at support@geointel.org
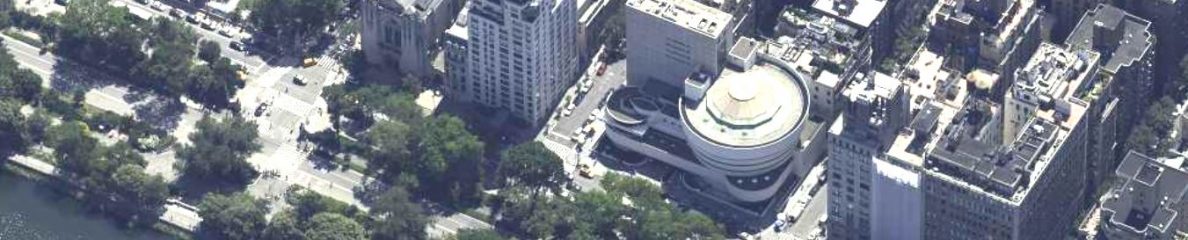
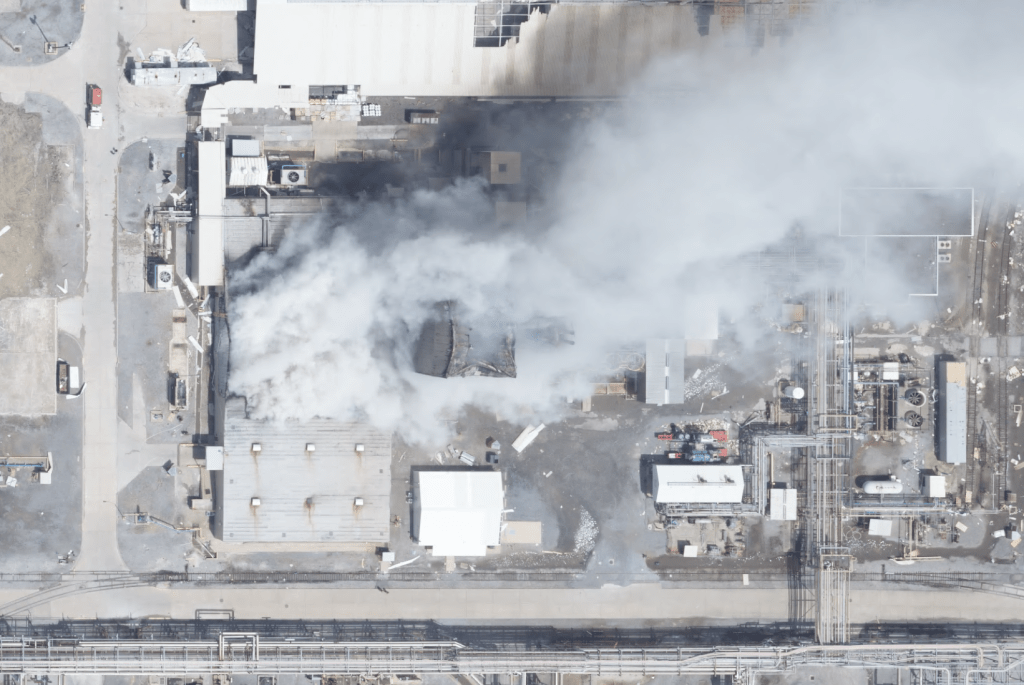
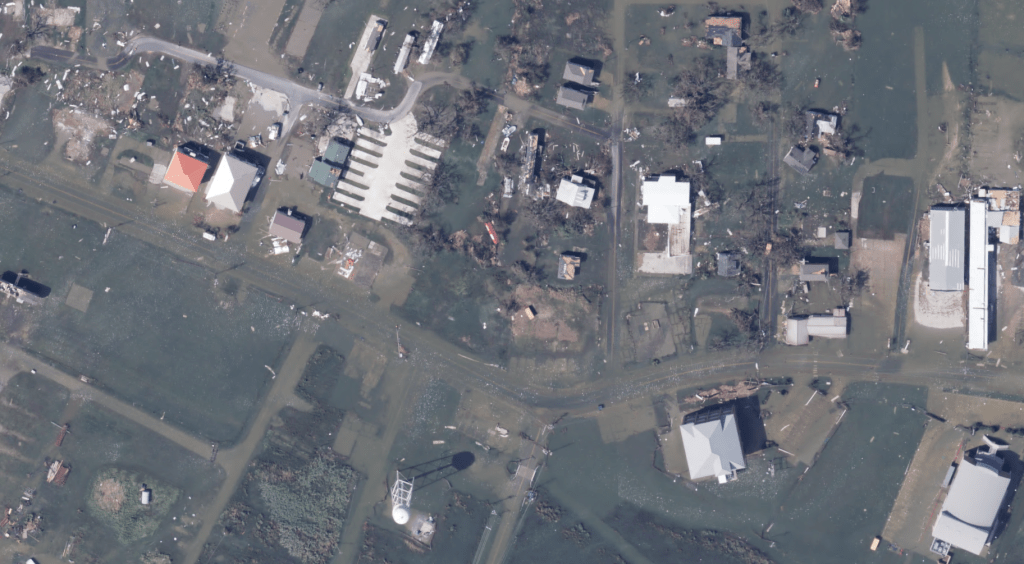
Our first round of collection for Hurricane Laura completed successfully yesterday, covering some of the hardest hit areas including Lake Charles, Beaumont and the gulf coast. Some samples are shown below at differing zoom levels; click each to view full screen and download.
We are continuing to collect today and invite GIC members, first responders, and state and local government to send their input to graysky@geointel.org
At 100 PM CDT, the eye of Hurricane Laura was located near latitude 27.3 North, longitude 92.5 West. Laura is moving toward the northwest near 16 mph (26 km/h). A gradual turn toward the north-northwest and north is expected later today and tonight. On the forecast track, Laura will approach the Upper Texas and southwest Louisiana coasts this evening and move inland within that area tonight. The center of Laura is forecast to move over northwestern Louisiana tomorrow, across Arkansas Thursday night, and over the mid-Mississippi Valley on Friday.
National Weather Service forecasts include “unsurvivable storm surge” with large and destructive waves will cause catastrophic damage from Sea Rim State Park, Texas, to Intracoastal City, Louisiana, including Calcasieu and Sabine Lakes. This surge could penetrate up to 30 miles inland from the immediate coastline. Only a few hours remain to protect life and property and all actions should be rushed to completion.
GIC maintains activation Level 2 – Partial Activation for California Wildfires and Hurricane Laura as well.
Initial areas of interest for imagery collection have been identified for the following areas:
Ultra-high resolution – Lake Charles, Louisiana
Ultra-high resolution – Beaumont, Texas
Ultra-high resolution – Port Arthur, Texas
Multiple resolution – coastal collect from Cameron, Louisiana to Galveston, Texas
High resolution – multi-jurisdictional regional collect
As this storm make landfall, GIC members are strongly encouraged to share specific requirements and areas of interest for collection with the Gray Sky team by emailing graysky@geointel.org.