We collected and published thousands of square kilometers of imagery over the California wildfires last week. As is often the case with wildfire imagery, some areas were still in heavy smoke cover when we flew. But because we collect in the near-infrared (NIR) band along with traditional RGB, there is still a great deal of utility in the imagery for understanding damage to structures in the affected areas. Further, with some dynamic range processing, it is also possible to see a lot of detail that would otherwise be lost in the smoke. Both of these image types are available as distinct layers in our Esri based web viewer.
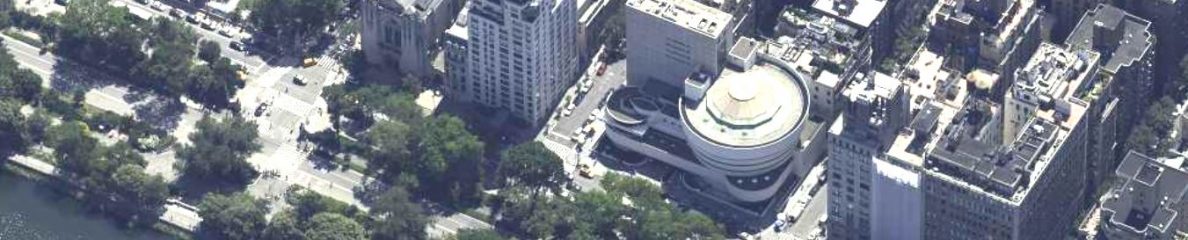
The image featured at the top of this post is an example of NIR imagery providing a good amount of detail for a property that would otherwise be nearly completely occluded with smoke. The same property is shown here in its original state, side by side with the version after dynamic range processing.
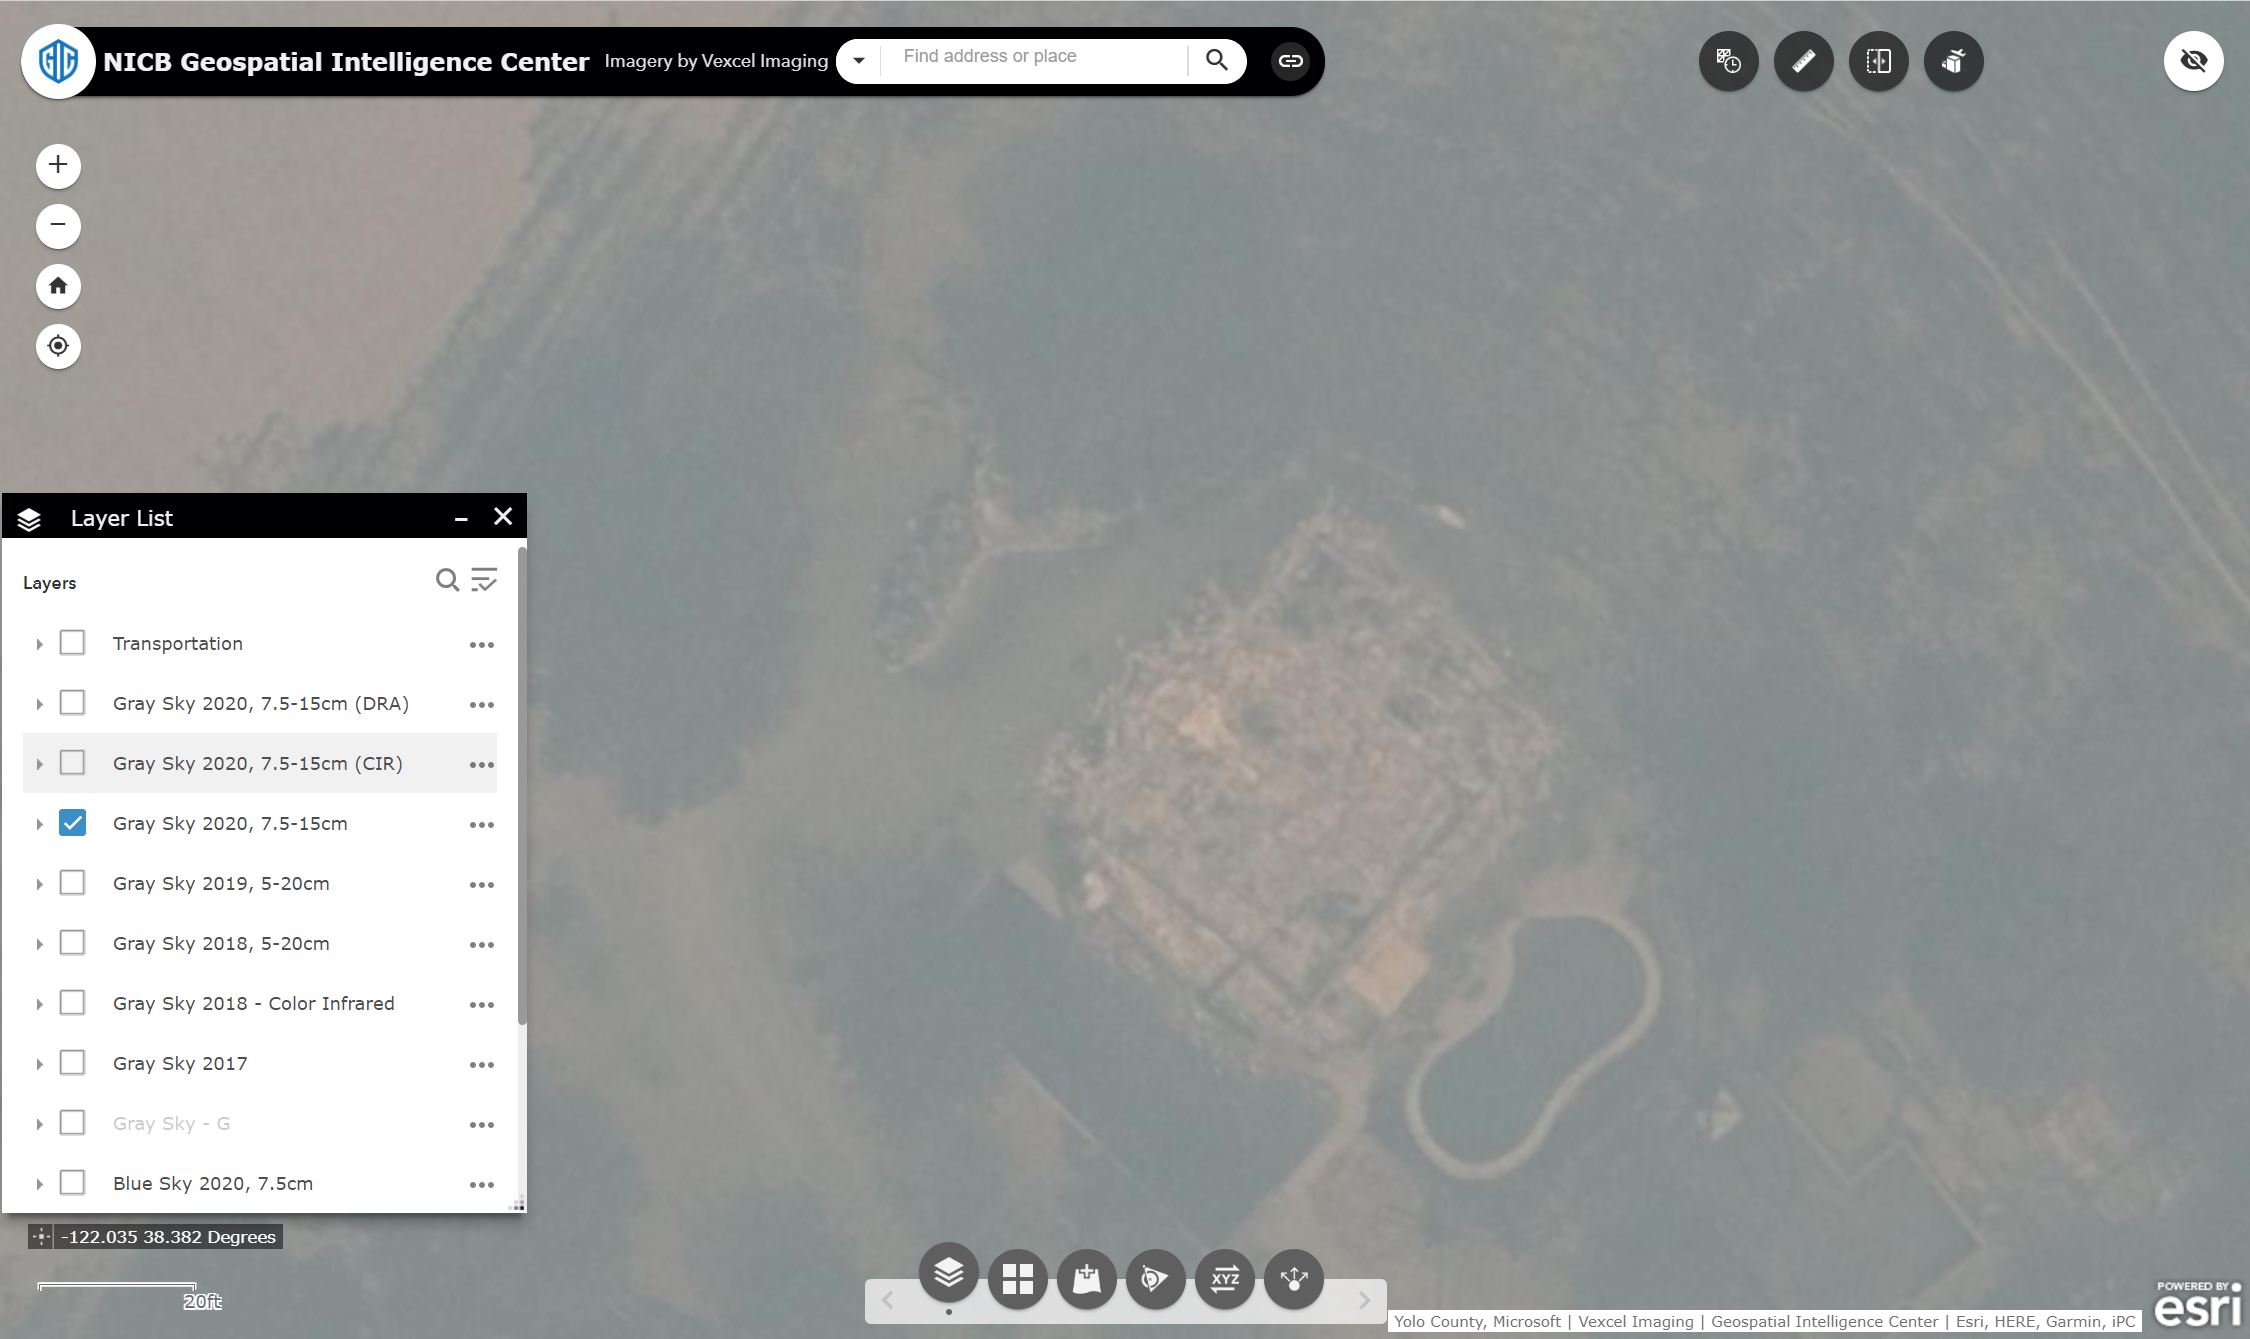
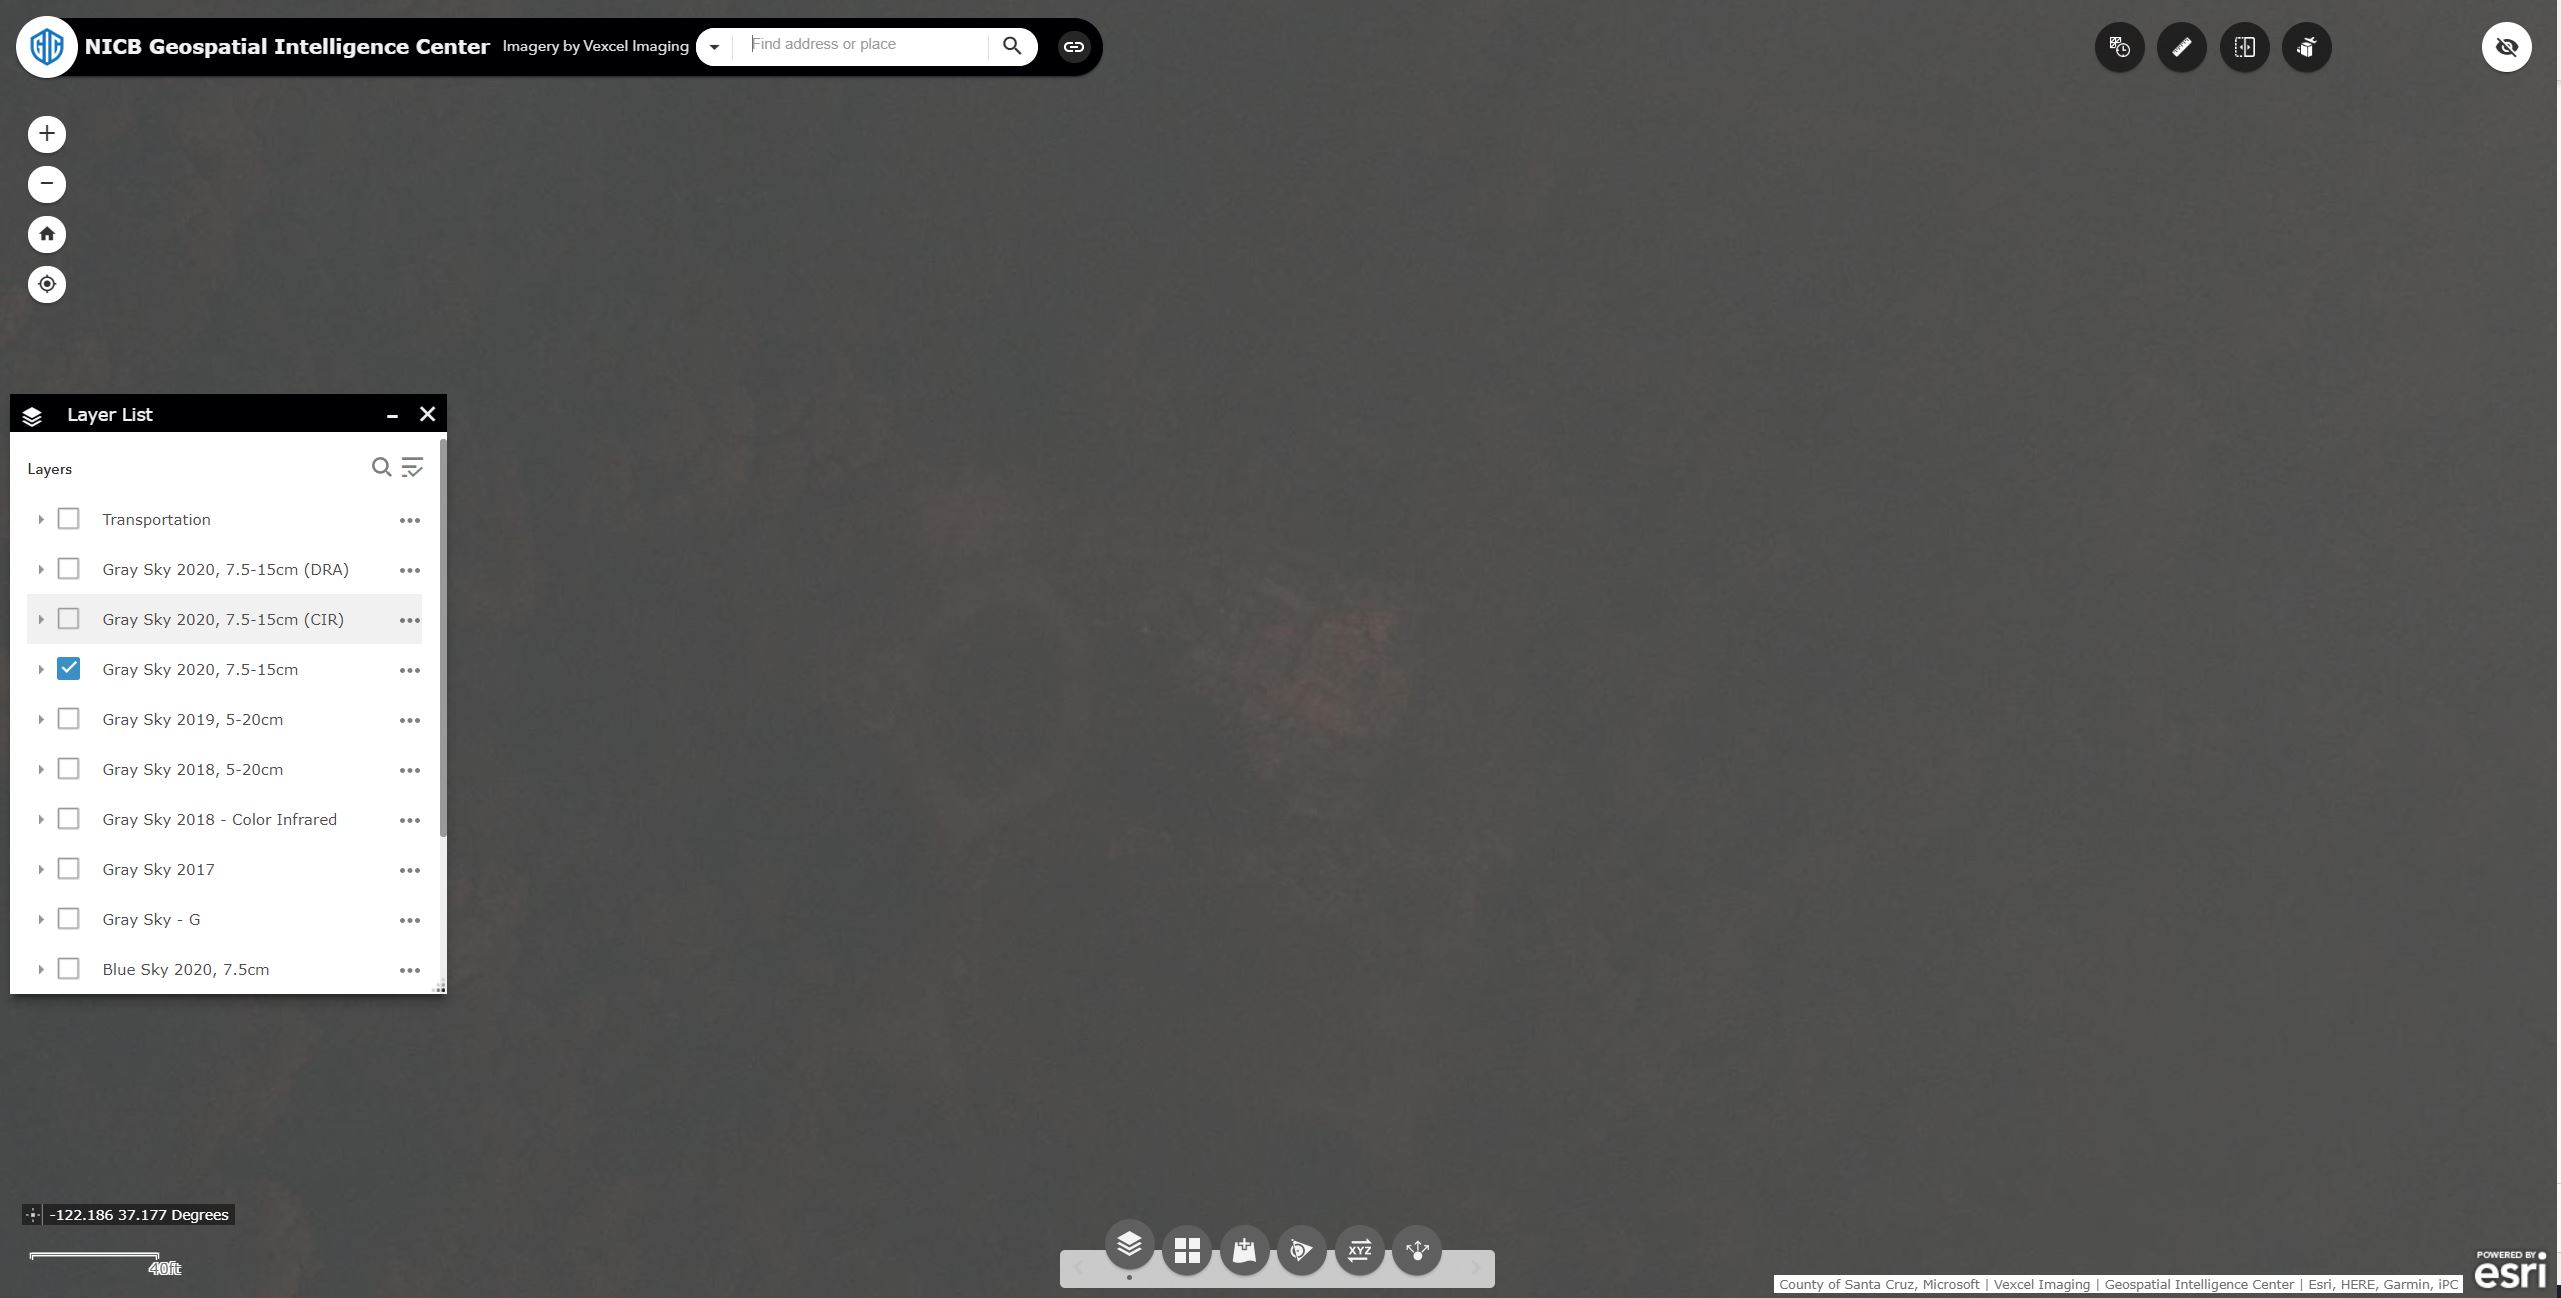
Here is another example with a heavier layer of smoke, along with the same near-infrared image. Although the NiR image may not look like a traditional RGB image you are used to, the information gleaned from it can help first responders make faster, more informed decisions in planning and logistics.
The Vexcel Web app is a powerful tool for accessing our entire imagery library. Although it is fairly intuitive to get started with, this post will provide a step-by-step quick-start for those of you wanting to access our disaster response imagery for the California fires. Additionally I’ll show the steps needed to turn on the ‘dual view’ feature enabling easy side by side comparison for before and after looks at a property.
Before you get started, make sure you have an account to access our web app at https://app.gic.org/ Accounts are free to first responders and state and local government agencies needing access. Members of the GIC also have unlimited site license to access the app. If you need an account email us at support@gic.org.
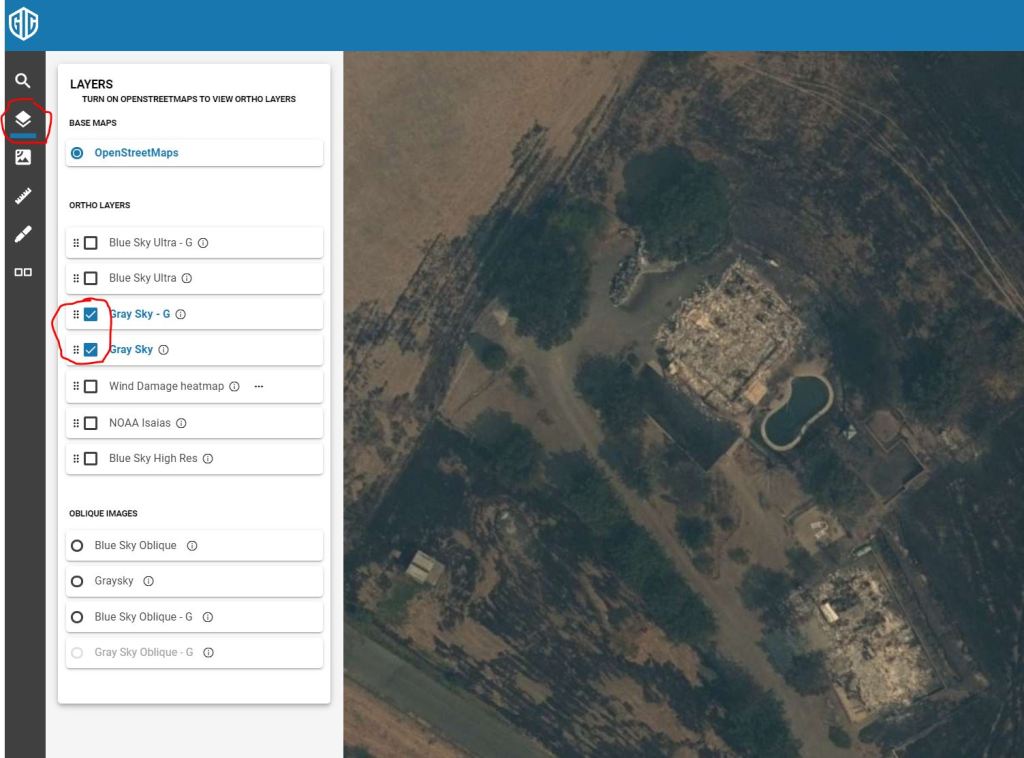
One more thing to understand as you go through this tutorial – ‘Graysky’ refers to our disaster response imagery, typically captured after a hurricane, tornado, wildfire, etc… while ‘Bluesky’ refers to our high quality aerial imagery captured with good weather conditions and sun angle. Our focus in this tutorial is to inspect a property damaged in the wildfires using our Graysky imagery, but then to use the Bluesky imagery to see what it was like before the fires.
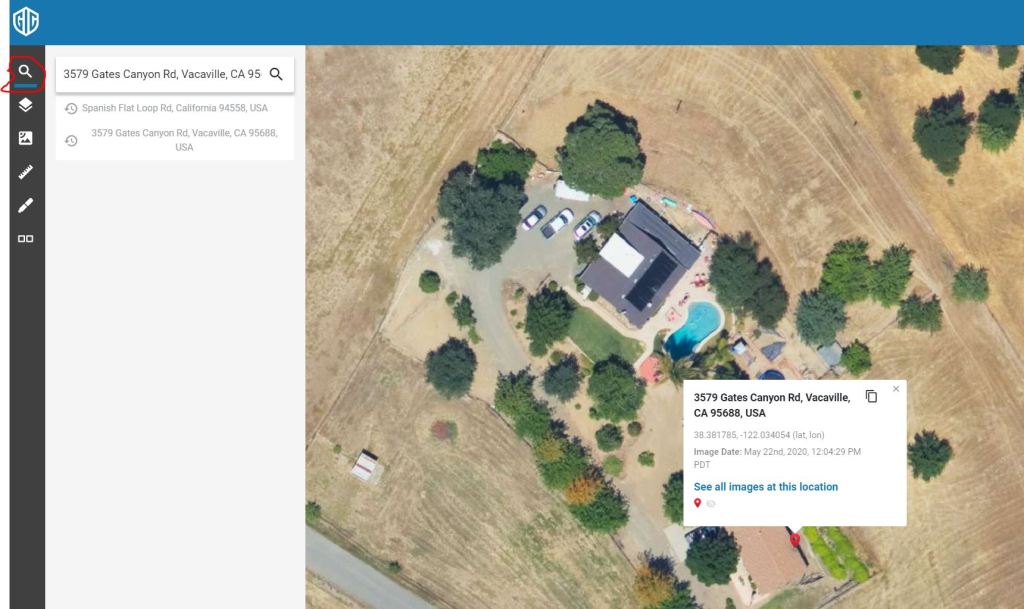
OK, with that housekeeping out of the way, lets get to it. We’ll use this address in the steps below: 3579 Gates Canyon Rd, Vacaville, CA
Step 2: The Search tool is at the top of the toolbar on the left side of the app. Enter the address and hit return. Like any other web map app that you have used, you can zoom with your mouse wheel, the + and – keys on your keyboard, or the zoom buttons in the lower right of the screen. If you have a touch screen (how do you work without one?!?) you can pinch to zoom as well. Go ahead and zoom in for a nice tight view of the property as shown below.
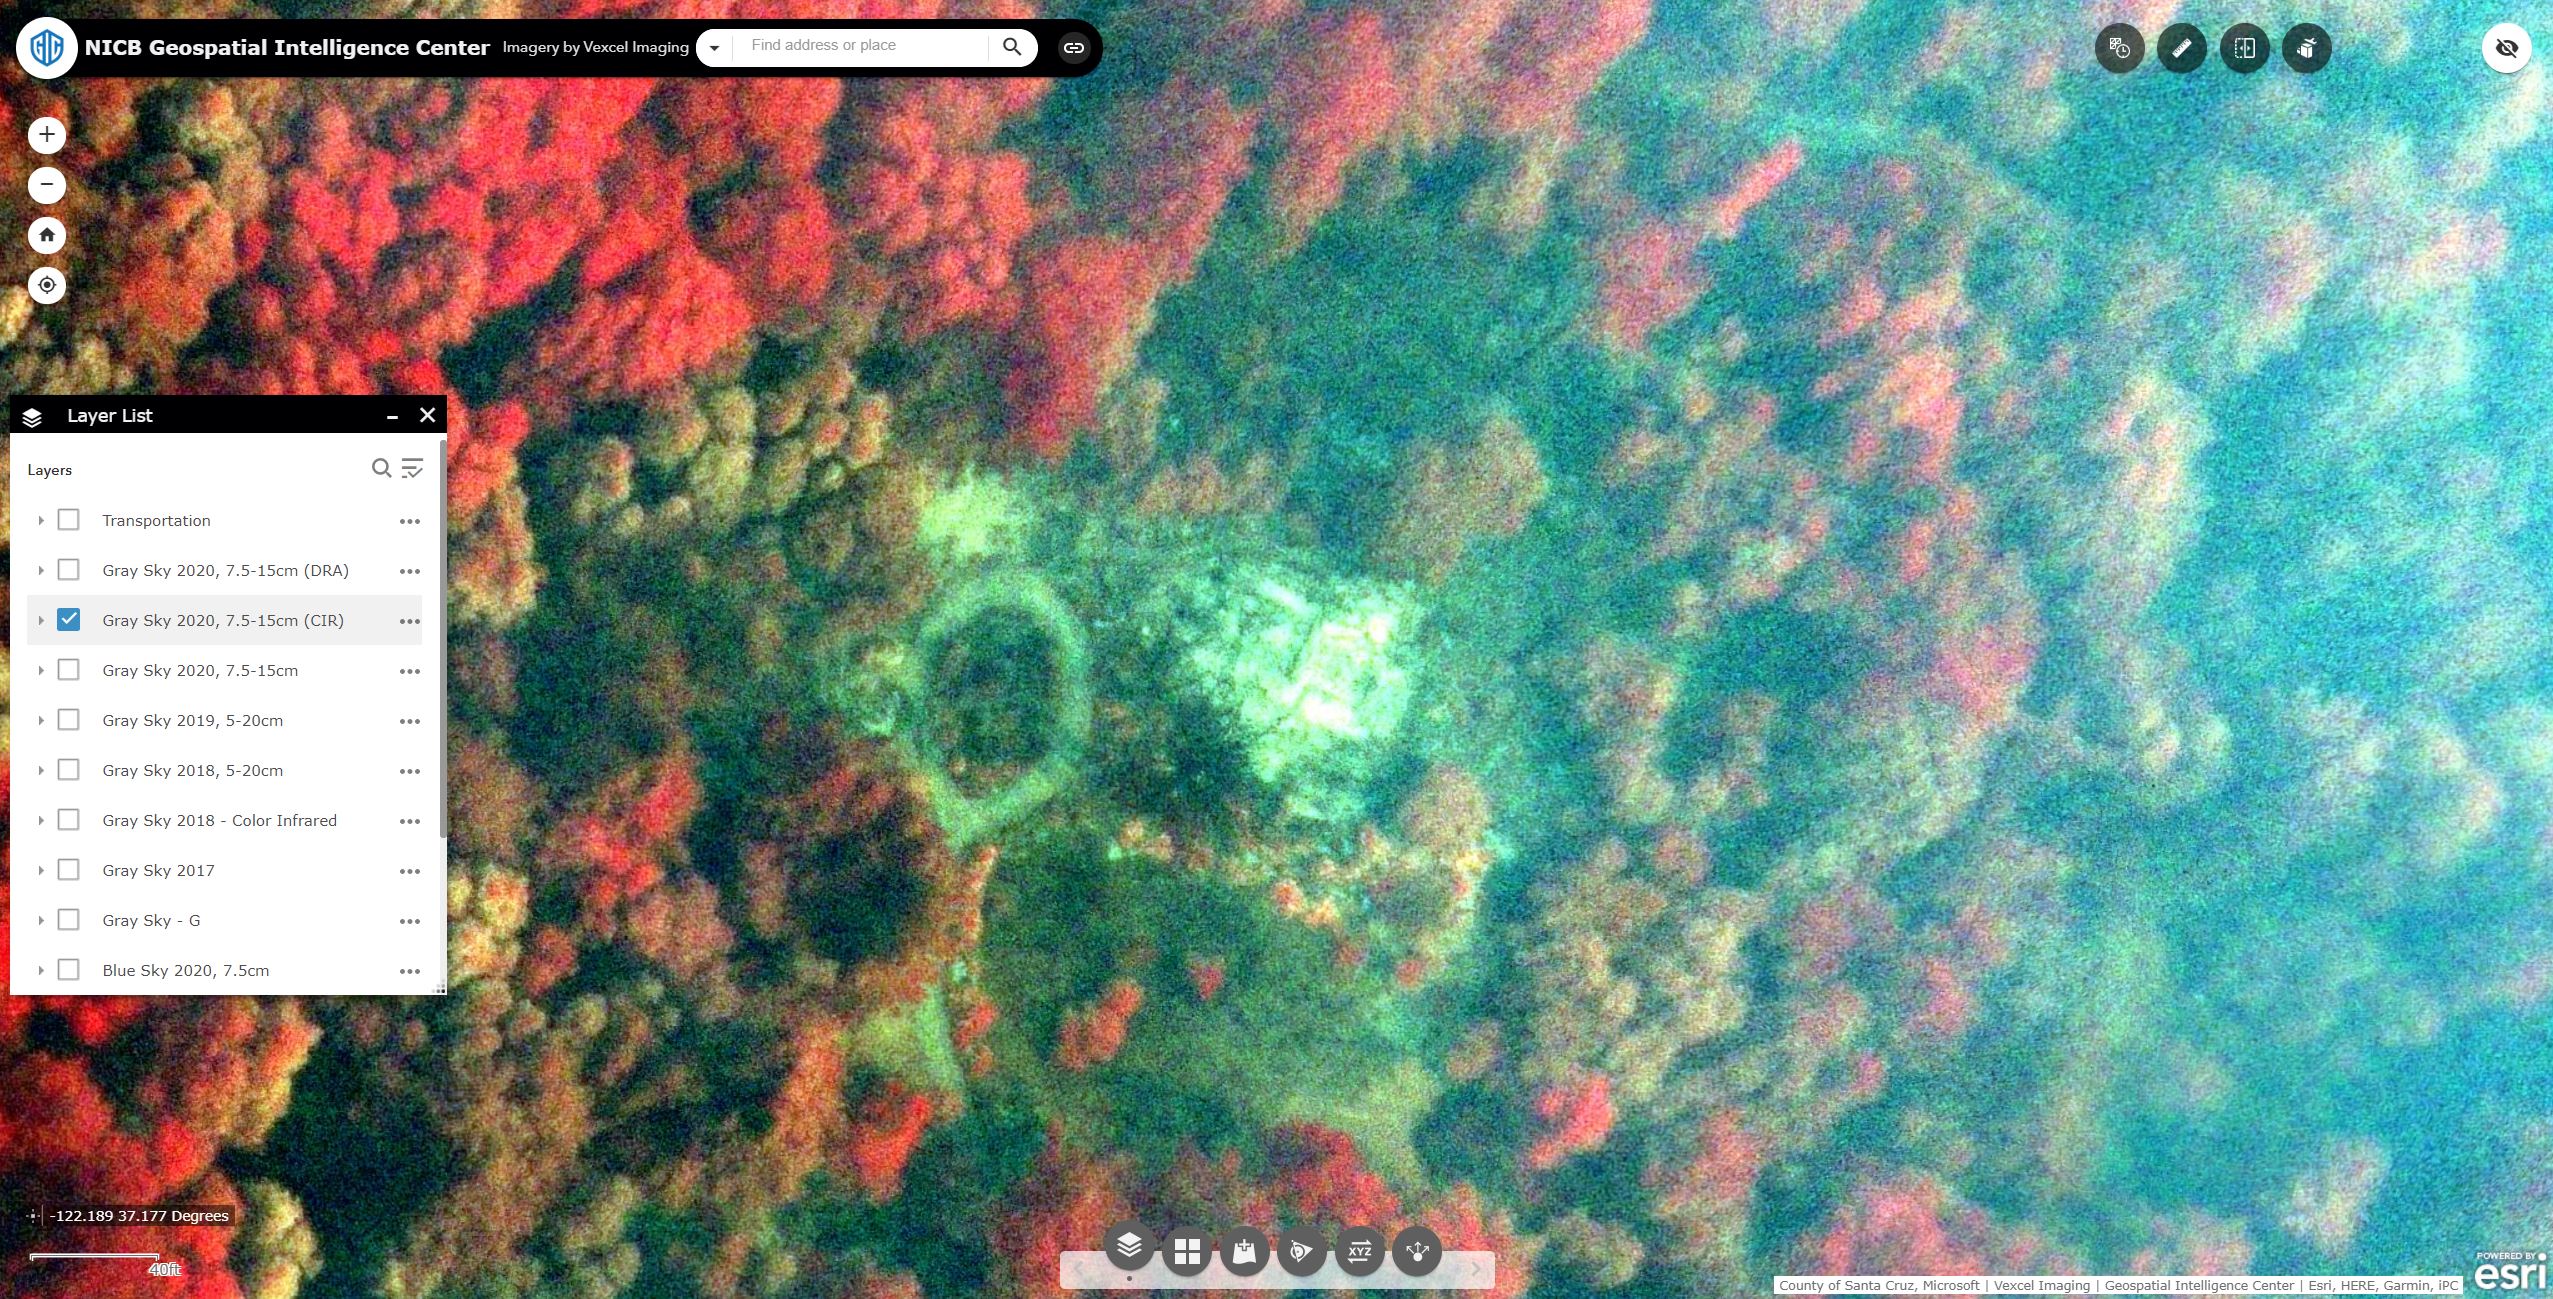
Step 3: The second icon down on the toolbar is the layer control. In a mapping app, typically the top most layer in the list is the one you are seeing on the map canvas. Since we want to see the wildfire imagery, uncheck all of the layers except for the Graysky layers. The date the image was captured is always shown in the lower right portion of the screen. You can also right-click anywhere on the map and choose ‘Get Info’ to display the address, coordinate and capture date. FOr our example address, we can see the image was captured on August 22nd.
Step 4: The Dual view icon is at the bottom of the toolbar on the left. Click it to split your screen in half providing two synchronized views. As you navigate on one side of the map, the other side will be kept in synch. Initially you will have the SAME layer visible on each side of the interface, but you can use the layer control on either side to change that. This feature is most often used to have Graysky on one side with blue sky on the other as shown here.
I hope you find this quick tutorial helpful in getting started viewing our disaster response imagery. The features shown here just scratch the surface of what you can do in our web application. If you want to learn more, I suggest checking out some of the videos in our help center or the Vexcel Viewer User Guide.