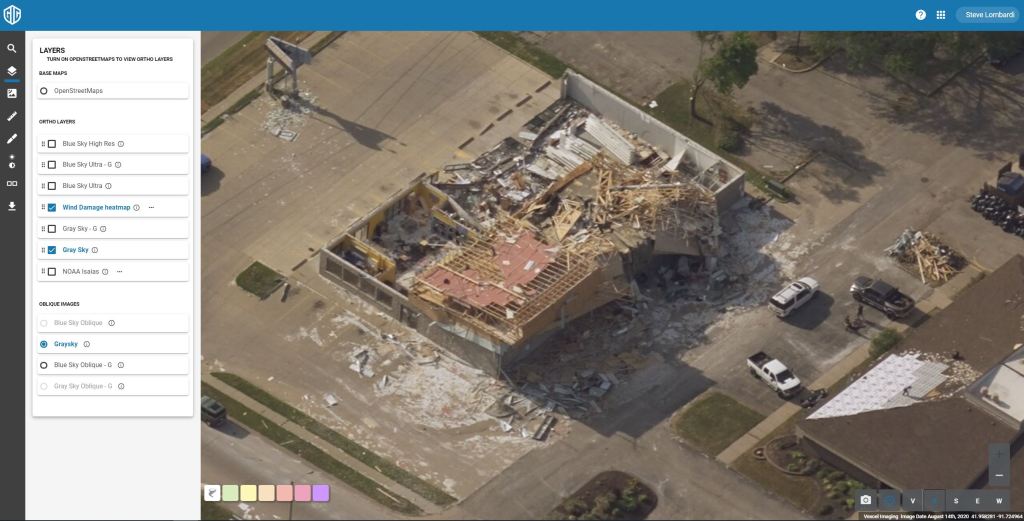

Yesterday GIC responded to the midwest derecho catastrophe collecting imagery over Cedar Rapids, Iowa. this Imagery is now available on the Vexcel Platform as well as via our ArcGIS services. Additionally, through our partnership with the Labs at Munich Re, an AI generated heat map of the wind damage is included. After each hurricane or tornado event that we collect, the Munich Re team runs the imagery through their computer vision system trained on wind damage, scoring each building structure in the affected region on a zero to five scale, considering factors like roof damage, downed trees and blue tarps.
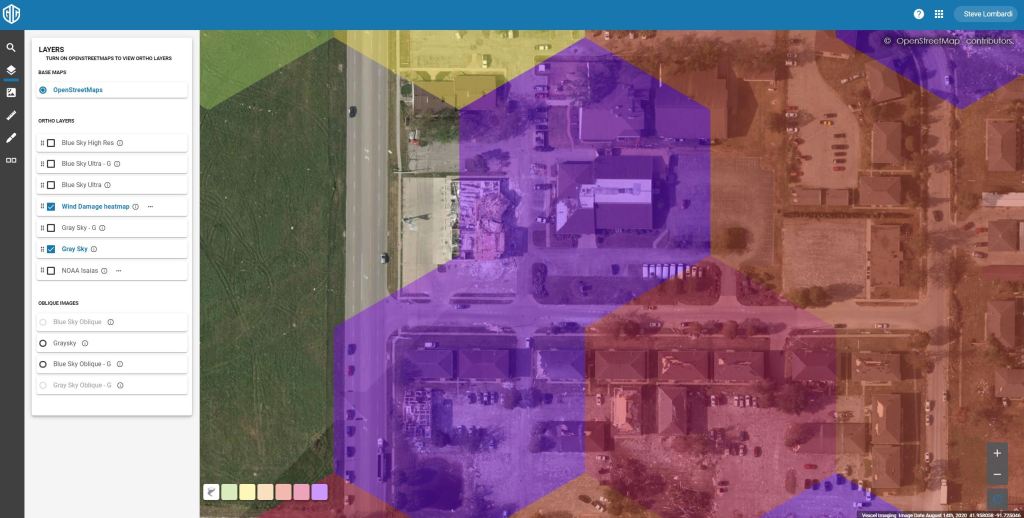
The result is an interactive color-coded hex map that reveals more detail at each zoom level. After a cat event like this tornado in Iowa, it makes it easy for insurers to overlay their PIF and focus immediately on the hardest hit areas. In the image above we have 4 violet cells at the center, indicating the most severe damage. As we zoom in on this area more detail unfolds until we reach street level to inspect the individual properties.
and of course down at street level, you can toggle on our oblique imagery to continue inspecting the damage with our 360 degree view of each property in the region.