
Among the data products we provide, Infrared imagery is among the more specialized. To help us understand what infrared imagery is and how we can best utilize it, I called on Bernhard Schachinger in our Graz office to share his insights. Bernhard is not only an expert in our camera systems, but also the processing of the raw data that comes from the sensor and the creation of our data products.
The image above is a high resolution example from Graz, where red shows clearly the vegetation, yellow a particular type of roof and almost normal greyish color tones show roads and other types of roof. In combination with RGB, this is a very important source of information for powerful image classification.
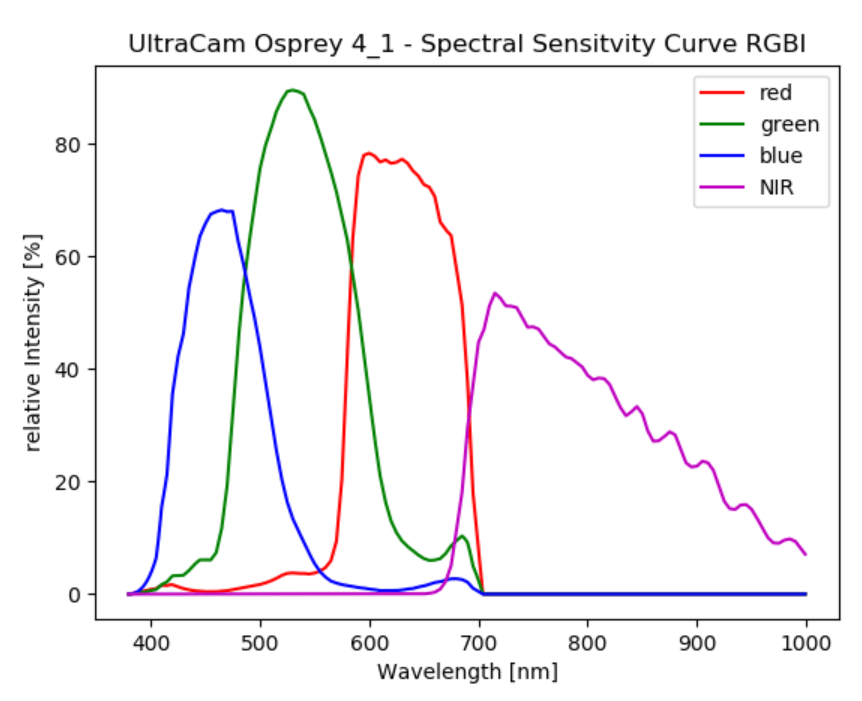
The near-infrared band (NIR) is close to the visible range of the red channel and covers the wavelength from ~670 nm to ~1050 nm. See the graph below for the spectral sensitivity curves for RGBI channels, as we include it in the camera calibration reports for Ultracam Osprey 4.1 (UCO 4.1).
The motivation to capture NIR is a characteristic of vegetation which is measurable in the reflectance. A good explanation can be found here on wikipedia. NIR can not only give some information about the type but also about the health/growing period of the vegetation.
Here is an important except:
Red edge refers to the region of rapid change in reflectance of vegetation in the near infrared range of the electromagnetic spectrum. Chlorophyll contained in vegetation absorbs most of the light in the visible part of the spectrum but becomes almost transparent at wavelengths greater than 700 nm. The cellular structure of the vegetation then causes this infrared light to be reflected because each cell acts something like an elementary corner reflector.
The phenomenon accounts for the brightness of foliage in infrared photography and is extensively utilized in the form of so-called vegetation indices (e.g. Normalized difference vegetation index). It is used in remote sensing to monitor plant activity
Color-infrared images (CIR) are created with this combination of bands: R = NIR, G = Red, B = Green. CIR imagery is mainly used for detecting vegetation and water bodies, but also supports the identification of roads and buildings. Examples for use cases:
- To analyze the biomass, e.g. identification of forest areas with bad health for forestry or risk assessment (fires, bark beetle)
- Analysis of agricultural fields, e.g. checking the growth rate, irrigation, use of fertilizers
- Supporting classification tasks (vegetated, non-vegetated, water bodies)
- Checking for living/dead vegetation after disasters
A useful tool to accomplish these tasks is the Normalized difference vegetation index (NDVI), which can be calculated from our imagery. here is a good article explaining NDVI in detail. The advantage of the NDVI vs RGB-based methods is that this index compensates for changes in light conditions, surface slope, exposure and such external factors.
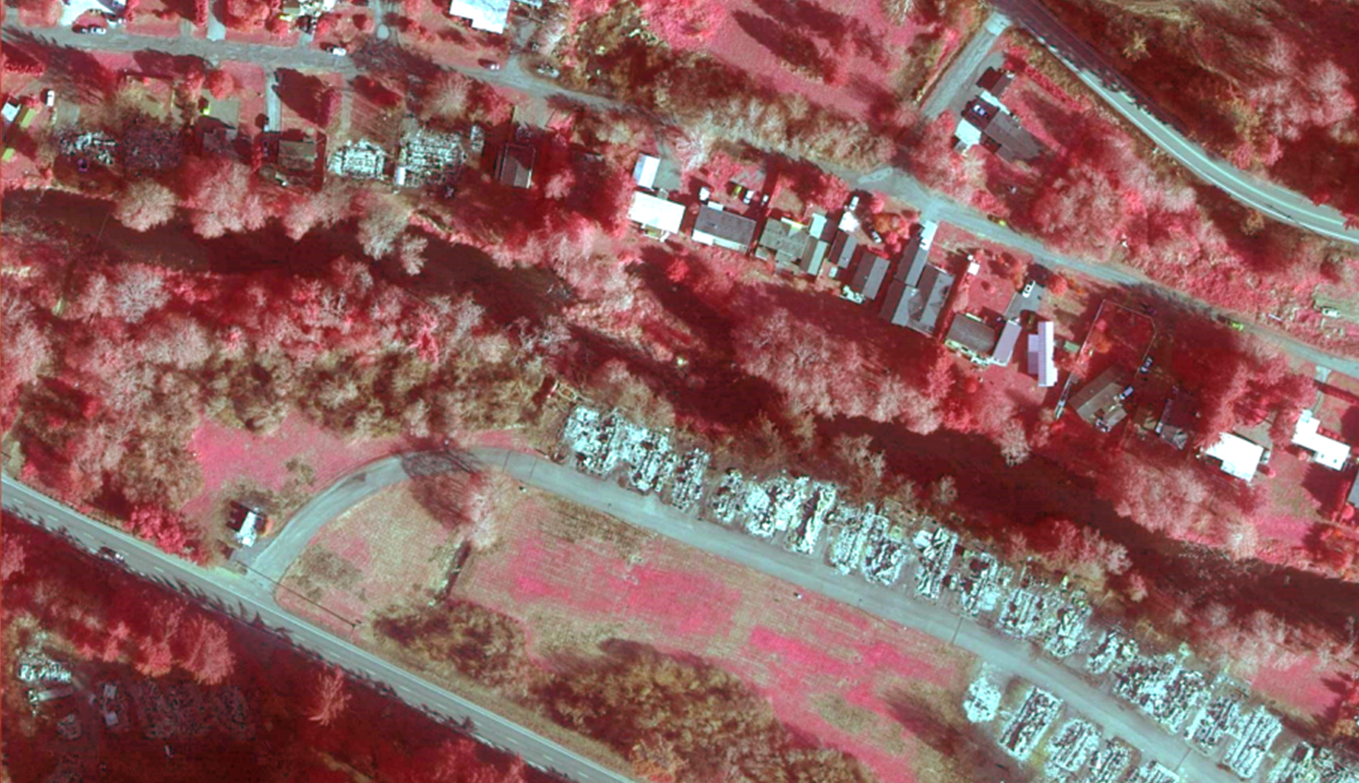
Here is another example from our disaster response imagery pulled from the recent Oregon wildfires. we can see with red color healthy trees/grass and with brownish/greyish color tones burnt vegetation. Buildings are also clearly visible. In this case, the CIR is an additional help for the human eye to identify burnt areas.
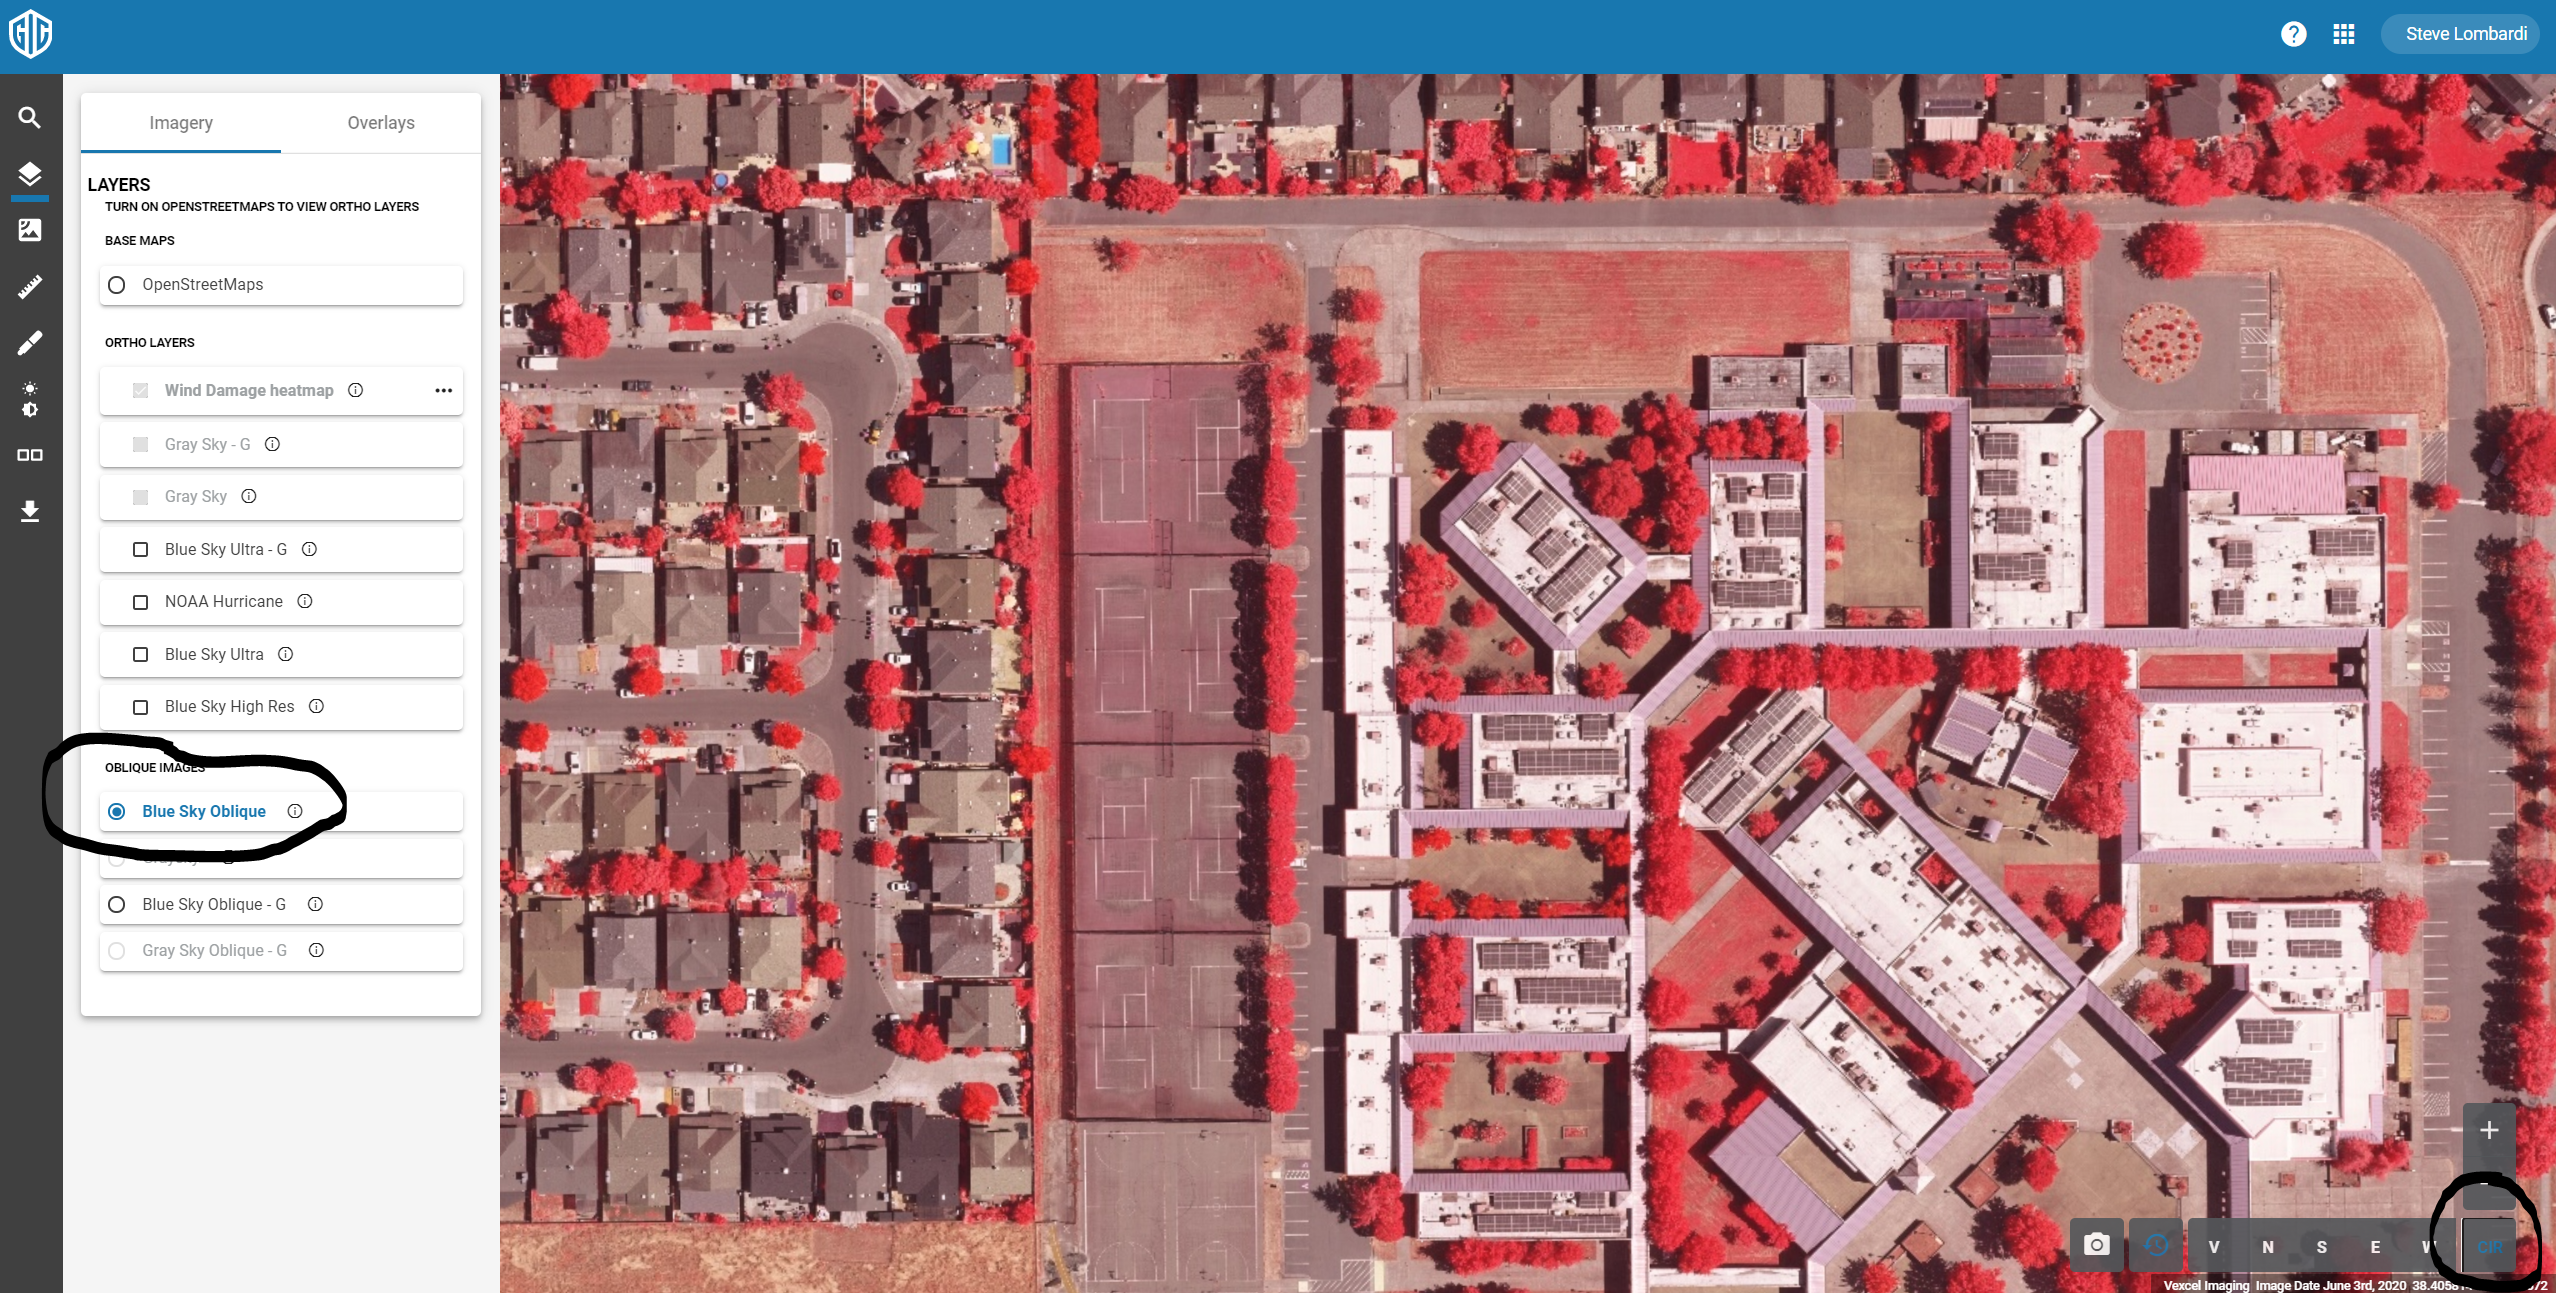
CIR imagery has been available via our API’s for a while now, but this week we introduced this image type into our web application. To access it, go to Oblique mode for the Blue Sky Ultra layer and click the CIR button in the lower right of the screen as shown here: